Difference between revisions of "Mookodi time-stamp tests"
From SAAO TOPS Wiki
(→Results) |
(→Results) |
||
| Line 6: | Line 6: | ||
== Results == | == Results == | ||
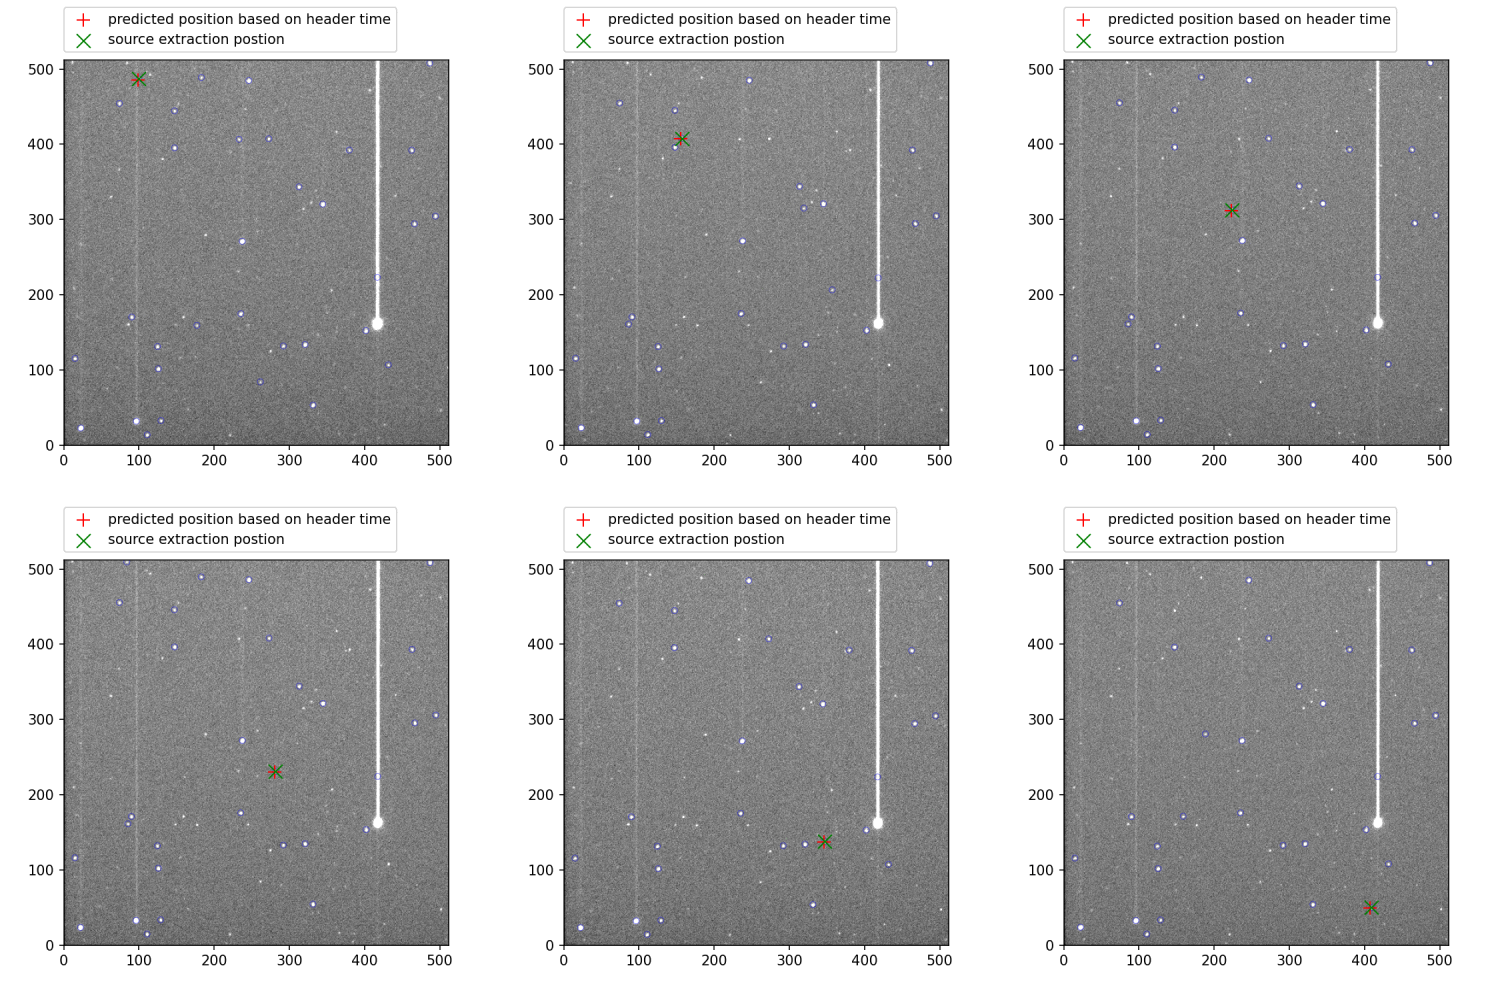
| − | *'''Example data:'''[[File:mookodi_sat_pred_vs_source_pos.gif|frame|left|Figure1: Shown is an animated gif of 50 frames @ 2×2 binning, fast (5 MHz) readout rate, and 100ms exposure time per frame. Note the readout smear particularly apparent for bright stars due to the shutter set to the "ALWAYS-OPEN" mode which is '''MANDATORY''' for continues fast imaging. Approximate time between each frame is ~400ms (i.e., ~300ms dead-time between each frame due to image readout time, header information collection + population into fits header, and file written to disk). CCD is flushed to clear any charge collected on the chip during dead-time before next frame is taken. The blue circles show the auto-detection of sources and which are used for astrometric calibration. The red cross shows the predicted postion of the satellite at the header time (keyword=DATE-OBS)+half the exposure time (in this case 50us) by querying an independent external satellite database. The green cross shows the position of the auto-detected source extracted that is closest predicted postion]] | + | *'''Example data:''' |
| + | [[File:mookodi_sat_pred_vs_source_pos.gif|frame|left|Figure1: Shown is an animated gif of 50 frames @ 2×2 binning, fast (5 MHz) readout rate, and 100ms exposure time per frame. Note the readout smear particularly apparent for bright stars due to the shutter set to the "ALWAYS-OPEN" mode which is '''MANDATORY''' for continues fast imaging. Approximate time between each frame is ~400ms (i.e., ~300ms dead-time between each frame due to image readout time, header information collection + population into fits header, and file written to disk). CCD is flushed to clear any charge collected on the chip during dead-time before next frame is taken. The blue circles show the auto-detection of sources and which are used for astrometric calibration. The red cross shows the predicted postion of the satellite at the header time (keyword=DATE-OBS)+half the exposure time (in this case 50us) by querying an independent external satellite database. The green cross shows the position of the auto-detected source extracted that is closest predicted postion]] | ||
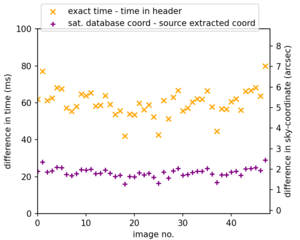
*:'''Plots:''' | *:'''Plots:''' | ||
Below | Below | ||
[[File:mookodi_delta_t_plot.png|thumbnail]] | [[File:mookodi_delta_t_plot.png|thumbnail]] | ||
Revision as of 15:17, 14 April 2022
To verify the time-stamp accuracy of the DATE-OBS header keyword recorded in the fits header for images captured by Mookodi we make use of the procedure suggested by Project Pluto as described here.
Method
The method entails observing a fast moving Global Navigation Satellite Systems (GNSS) satellite has a have very accurately known sky-coordinate for a given time. By comparing the observed sky-coordinate of the satellite in your images (after doing astrometric calibration of your images) to the predicted sky-coordinate of the satellite at the respective header time (and knowing the sky-rate of the satellite) it is possible to determine the accuracy of the time-stamps in your image headers.
Results
- Example data:

Figure1: Shown is an animated gif of 50 frames @ 2×2 binning, fast (5 MHz) readout rate, and 100ms exposure time per frame. Note the readout smear particularly apparent for bright stars due to the shutter set to the "ALWAYS-OPEN" mode which is MANDATORY for continues fast imaging. Approximate time between each frame is ~400ms (i.e., ~300ms dead-time between each frame due to image readout time, header information collection + population into fits header, and file written to disk). CCD is flushed to clear any charge collected on the chip during dead-time before next frame is taken. The blue circles show the auto-detection of sources and which are used for astrometric calibration. The red cross shows the predicted postion of the satellite at the header time (keyword=DATE-OBS)+half the exposure time (in this case 50us) by querying an independent external satellite database. The green cross shows the position of the auto-detected source extracted that is closest predicted postion
- Plots:
Below
